![]()
![]() (only
available for certain programmable terminals)
(only
available for certain programmable terminals)
Syntax for a bargraph in a backslash sequence
See also:
The bargraph functions are only supported by certain UPT variants with firmware from August 2002 or later.
Bargraphs may look like this:
(Screenshot of a bargraph demo for the old
MKT-View with monochrome display, programs/cdb_tst1.ct )
Every bargraph has a set of properties which must be defined on a special panel on the 'display line property' tab of the programming tool. More properties can be set in a special window which appears when clicking the "more" button (because we ran out of space on the "Bargraph" tab shown below)...
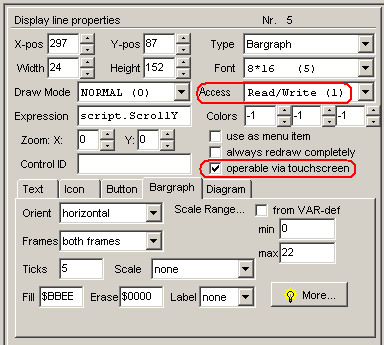
(Bargraph properties as part of a 'display element definition' in the main window)
The general properties like x-pos, y-pos, draw mode, etc are explained somewhere
else. They also apply to normal text display.
Properties like 'Access'
(access rights: read/write) and the option 'operable via touchscreen'
will turn the 'simple Bargraph' into an interactive control element,
like a scroll bar or 'value slider'.
The specific bargraph properties should be modified on an extra panel, which can be opened by double-clicking on a bargraph in the graphic editor, or by clicking the 'more' button on the main window's "bargraph" tab.
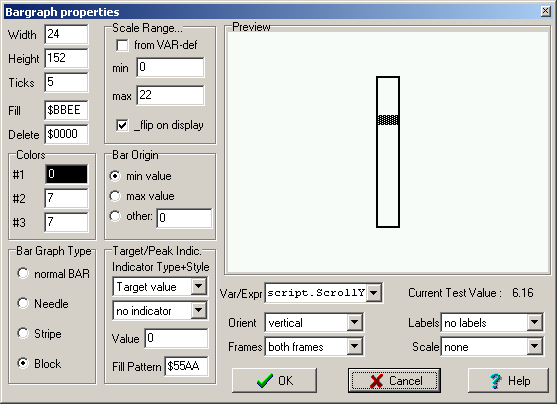
(Bargraph configuration dialog window, with 'specific' properties)
pktime=100 sets the peak-detection-interval-time
to 10 seconds.pktime value only in a "page-enter"
event of page zero.
Because most terminals only have a simple black- and white display, different filling patterns can be used to fill the inner bargraph areas.
The filling pattern is defined as a 16-bit value (usually in hexadecimal notation). The lower 8 bits are used to fill 8 pixels in EVEN screen lines, the upper 8 bits for ODD lines. This can be used to create a large number of different filling patterns --- 65536 mostly useless combinations. Here just some patterns, generated with the programming tool itself:
(Screenshot with "Filling Patterns" for a monochrome bargraph)
As mentioned before, the hex coded values are actually pixel-masks for monochrome displays. Viewed from the distance, they give different shades of gray. If you have a terminal with a color display, the "foreground" and "background" color values defined on the property panel are also used for the bargraph (not only for normal text). For colour displays, use suitable colours instead, and only use filling patterns 0x0000 (-> background colour) and 0xFFFF (-> foreground colour).
(only for curious or experienced users)
Internally, the bargraph is coded as a backslash sequence. The UPT's interpreter analyses it just like any other format string in a display command (which allows you to place leading text before the bargraph sequence). If you prefer writing the source code for a display page with a text editor instead of clicking it together with the mouse, this is for you:
Syntax:
\bar(width, height, flags, ticks, filling_pattern, erase_pattern,
[scale_min, scale_max] )
where: width,height,ticks,filling and erasing pattern are the same properties as mentioned earlier.
The "flags" parameter is a bitcombination of orientation, frames, scale-style and scale-range-info (two bits per property).
The scale range (scale_min and scale_max) may only be defined in the backslash sequence if the min/max-values are NOT taken from the variable definition.
Using a bargraph in a display definition without leading or trailing text should't be a problem, because (for devices with 32-bit CPU since 2009), a single display page may consist of a very large number of display elements, thanks to the 'flexible' storage of objects in the terminal's FLASH memory.
Disadvantage of specifying the scale range here as argument: It makes a display page less "universal". If you programmed a display page with 8 horizontal bars for temperatures in the range -50° ... +200° and want to re-use that page later to display 8 voltages in the range 0..50 Volts, you must adjust the scale range manually. Better: Use variables with a proper min/max-range in the VARIABLE DEFINITION TABLE (or the CANdb-definition) and activate the checkmark "Scale Range from VAR DEF".
See main manual.