
 (only for devices with 32-bit CPU, see feature-matrix / "DAQ")
Contents
- DAQ Principle
- DAQ Configuration
- Configuring DAQ channels to 'feed' Y(t)-diagrams
- Connecting DAQ channels to analog inputs (and similar onboard I/O)
- DAQ Sampling Rate
- Checking the DAQ configuration at runtime ("Diagnostics")
- DAQ Trigger
- Reading DAQ channel memories via Script
- DAQ Examples
The data acquisition unit (called DAQ hereafter) is a multi-channel digital
sampler for signals received via CAN, or signals digitized by the
onboard analog inputs, etc.
Samples acquired by the DAQ are first stored in a FIFO (circular buffer for all channels).
This FIFO can be used as data source to plot the sampled data as a function of time with high resolution.
In addition, certain devices can access the data in the FIFO via script,
to process them in many ways (e.g. Fast Fourier Transform to analyse a signal's spectrum; e.g. find
peak frequencies and magnitudes of vibrations in real time, etc).
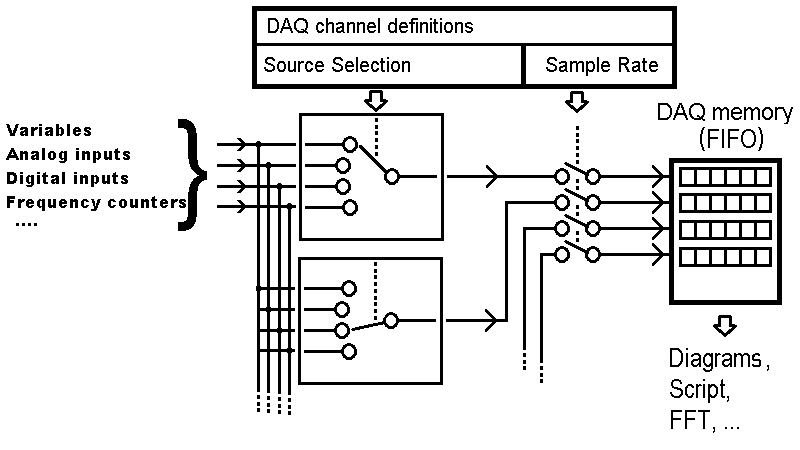
DAQ block diagram and signal flow
For 'normal' displays (numeric, or as diagramm with sampling rates below 10 Hz), the DAQ unit is not required.
In most cases, the DAQ is used as fast-sampling sampling buffer for Y(t)-diagrams.
Key features:
-
on old devices with 16-bit CPU, up to 1000 samples / second for each channel (as long as CAN bus protocol
allows;)
-
on devices with 32-bit CPU (MKT-View III, IV), 10000 samples / second or even more
-
at least 4, for newer devices 8 channels may be simultaneously in use
-
channel memory type either 32-bit integer (preferred) or 32-bit floating point
-
on devices with onboard analog inputs (MKT-View III,IV), DAQ channels may be connected to those inputs 'directly'
When triggered (or periodically), the contents of the DAQ's channel memories
can be plotted into the UPT's Y(t)-diagram, using
the interpreter command dia.plot_daq .
Normal sources for the measuring channels of the DAQ unit are defined on the
Variables property of
the programming tool. Use the checkmark in the right part of the definition screen:

To connect a variable to one of the DAQ channels, just set the checkmark
Connect to DAQ Channel.
The programming tool will try to find the next unused DAQ channel, and
automatically enter the channel number (index running from 0 to 7)
into the edit field right next to the checkbox.
This way, the DAQ will know how to receive, and decode, a certain signal.
To disconnect a variable from the DAQ, uncheck the option. This will
automatically remove the DAQ channel number from the variable definition
table.
On a sufficiently large screen, you can see the DAQ channels 'occupied'
by UPT display variables in the last column of the variable definition table:

Variable definition table with DAQ channel numbers shown on the right
The above screenshot was taken from application 'DAQ_test.cvt'.
In this example, the DAQ was used for a fast-running Y(t)-diagram.
Configuring DAQ channels to 'feed' Y(t)-diagrams
To (re-)configure an existing Y(t)-diagram to use the DAQ to achieve higher sampling rates,
you can use the button labelled 'Connect XYZ to DAQ' (where XYZ is the variable name for the currently selected
diagram channel, e.g. 'Motor_RPM') on the 'Channels, Mode, Timebase
tab in the diagram configuration dialog.
The use of the button is almost trivial:
First select (mark) the desired diagram channel in the definition table (under 'Channels').
Only if the diagram channel's source is not a DAQ-channel yet (e.g. 'RPM' instead of 'daq[0]'),
the button mention above is enabled, and (for example) offers to Connect 'RPM' to DAQ.
The programming tool will automatically pick the next unused DAQ channel.
Notes about the DAQ in combination with Y(t)-diagrams:
The DAQ-channel-number is not necessarily equal to the diagram-channel-number !
Since 2018-09, the firmware starts collecting data for diagrams
before a diagram gets visible even without the DAQ.
In addition to UPT-'display'-variables, a DAQ channel can also be connected
to any of the 'onboard' analog inputs (if such inputs exist). This allows
sampling those inputs faster than possible by other means (like polling
system.analog_in[] in a script).

DAQ channels and -options in the programming tool's main menu.
To assign DAQ channels to analog and similar inputs at design time, select
'Options'..'Data Aquisition Unit' in the programming tool's main menu,
then select the channel (0..7) in the sub-menu, and enter the one of the following keywords
in the input box (instead of the name of a display variable):
- analog_in[0]
- First 'onboard' analog input (exists in most 'MKT-Views', see Feature Matrix).
Scaling as for the corresponding script function system.analog_in[0] (floating point, 0 to 1.0 or -1.0 to +1.0).
- analog_in[1]
- Second 'onboard' analog input.
Scaling as for the corresponding script function system.analog_in[1] (floating point, 0 to 1.0 or -1.0 to +1.0).
- analog_in[2]
- 3rd 'onboard' analog input (only exists in certain devices like MKT-View IV, on an extra connector like "X4")
- analog_in[3]
- 4th 'onboard' analog input (only exists in certain devices like MKT-View IV, on an extra connector like "X4")
- mic_in
- Microphone input. In devices like MKT-View IV, the microphone signal (from 3.5-mm connector "X8")
can be fed into the DAQ like a high-gain analog input. For historical reasons, the value range is -32767 .. +32767.
- digital_in[0]
- state of the first 'onboard' digital input (0=logic low, 1=logic high)
- digital_in[1]
- state of the second 'onboard' digital input
- frequency_in[0]
- frequency measured at the first 'onboard' digital input (only for certain devices; must be enabled and configured as described here)
- frequency_in[1]
- frequency measured at the second 'onboard' digital input
- pulse_counter[0]
- number of pulses counted at the first 'onboard' digital input (only for certain devices; must be enabled and configured as described here)
- pulse_counter[1]
- number of pulses counted at the second 'onboard' digital input
The names (tokens) listed above can also be used in the channel definitions of a diagram (Y(t) or X/Y plotter).
If a DAQ channel is already 'occupied' by a variable, it will have the variable's name shown in the list (see screenshot).
By clearing or overwriting the name in the input box, the old variable will be 'disconnected' from the DAQ,
and the channel can be connected somewhere else (see list above).
Depending on the the source type, channels in the DAQ may use different sampling rates.
If a DAQ channel is used by e.g. an Y(t) diagram, the DAQ channel's sampling rate
is copied from the diagram's 'timebase'-setting.
If a DAQ channel is not used by a diagram, but you want it to collect samples
for other purposes (e.g. for processing via script),
configure the DAQ's sampling rate in the programming tool's main menu under
'Options'..'Data Aquisition Unit'..'Sample Rate' .
Then enter the desired sampling rate (measured in Hz aka 'samples per second) in the dialog box.
- Note
- The maximum realizeable sampling rate was 1000 Hz for older devices (like MKT-View, MKT-View II).
For devices with a faster CPU, much more can be achieved (MKT-View IV, V: 20 kSamples/second).
To develop 'portable' applications suitable for old hardware, keep the sampling rate
as low as possible to keep the CPU load low.
Since the addition of high-speed sample for audio inputs and certain on-board analog inputs
in some (not all) devices, it has become increasingly complex to check if the DAQ configuration
developed for one device will work the same way on an older device.
For example, a new MKT-View generation (like the MKT-View V anno 2024) may support higher sampling rates
for DAQ channels connected to certain channels of the internal A/D converter
than in older devices, or a larger per-channel memory, or a different number of analog inputs, etc.
To quickly check the momentary status of the DAQ (with all channels),
enter the device's System Menu (in most cases by pressing F1 and F2 simultaneously),
select Diagnostics .. Data Acquisition Unit (may have to scroll down to those menu items).
Depending on the actual hardware model (*),
this may open a screen like the one sketched below:
 Data Acquisition Unit (DAQ) status
 Chn Source       fSample  nSamples Age  Value
 0   ThreeSines1  1000     1024     20   12345
 1   ThreeSines2  1000     1024     18   0
 2   ThreeSines3  0        0        ---  (no data yet)
 3   FourSines1   0        0        ---  (no data yet)
 4   ana_in[0]    20000    1024     0    12
 5   ana_in[1]    20000    1024     0    1
 6   ana_in[2]    20000    0        ---  (source n/a)
 7   mic_in       20000    1024     0    -1965
 < Exit >    (scroll here and press ENTER to return to the menu)

     Scroll to select a DAQ channel
     to plot it in a 'live' diagram.
|
|
('DAQ Status' displayed in the 'Diagnostics' menu)
Columns displayed on the 'DAQ Status' screen:
- 'Chn' (Channel):
- Zero-based DAQ channel number (same as used by script commands to control the DAQ)
- 'Source':
- Signal source currently connected to a particular DAQ channel.
This may be the name of a display variable (like 'ThreeSines1' in the example),
or a token for special functions like onboard analog input ("ana_in"), microphone ("mic_in"),
digital input ("dig_in"), etc. Numbers in squared brackets are zero-based array indices.
- 'fSample' or 'fSamp' (depends on the available screen size):
- The DAQ channel's individual sampling rate in Hertz (aka 'Samples per second').
- 'nSamples' or 'nSamp':
- Number of sample points currently stored in this DAQ channel.
- 'Age':
- Age of the latest (most recent) sample stored in this DAQ channel, in milliseconds.
If, for example, the source is a display variable decoded from a CAN signal,
the DAQ channel memory may temporarily stop being filled. This would cause
the 'Age' of the data in the DAQ to increase, and (when displayed in a 'live' diagram)
"no data" in the associated diagram channel.
- 'Value':
- Current value of the most recent sample stored in the channel's array.
If the channel's array is still empty, or cannot be filled by the DAQ because
the source is (currently) invalid, the 'Value' column may show the reason in parenthesis:
- 'no data yet' : The source is principally valid, but didn't deliver any data yet.
- 'source n/a' : The source is not available, for example because the application (*.cvt)
was originally written for a device with more analog inputs
than supported by the currently used device.
For example, an MKT-View IV has four on-board analog inputs,
while the (smaller) MKT-View V only has two.
As in most screens of the 'System' menu, the white selection bar can be scrolled
through items (MKT-View: via rotary encoder; pressing the button replaces the ENTER key).
Scrolling the selection to a particular DAQ channel opens a simple 'oscilloscope'-like display
with the most recent entries in the selected channel's DAQ memory (array):
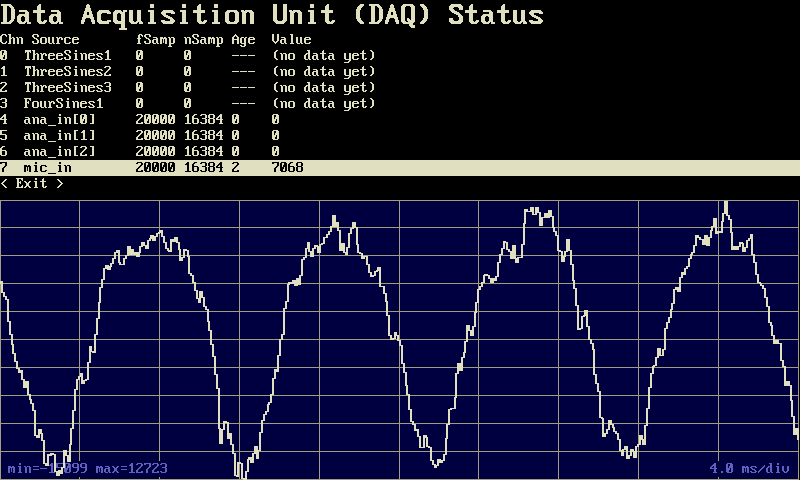
('DAQ Status' with a live display of the selected channel)
- (*) Note:
- The 'DAQ Status' display screen is only available in devices with sufficiently large
internal Flash for the device firmware, like MKT-View V with 2 MByte 'Firmware Flash'.
Note: The features described in this chapter are a work-in-progress, and currently only available
in the most recent 'Beta'
of the programming tool and device firmware for MKT-View IV !
Until finished, details are only available in the German variant of this document.
Besides feeding diagrams with fast-sampled input, the DAQ unit can also be used for digital
signal processing via script. The script command
daq.read_channel( <DAQ channel number>, <destination array> );
- Note
- Since November 2018, arrays declared in your script can not only store samples (and the number of samples),
but also a timestamp (<Array-Name>.unix_time)
and the sampling interval (<Array-Name>.t_sample,
which is the reciprocal of the sampling rate). No extra variables need to be declared for this.
The command daq.read_channel uses these components of the array-header to store the
timestamp of the most recent sample in the array, and the time between two sample points.
When plotting such arrays in a multi-channel Y(t)-diagram, these timing parameters are used
for the horizontal scaling.
If this automatism is not desired, the script can always overwrite these parameters in the array-header
after calling daq.read_channel.
A few DAQ examples are in the file DAQ_test.cvt
(located in the programming tool's "programs" folder). The application consists of several display pages:
On the first display page ("Analog"), the DAQ is used to collect samples from analog inputs (and, when available,
the microphone input) for a simple Y(t)-diagram (here: digital storage oscilloscope for low-frequency signals).
This simple example does not require a script - just connect a diagram channel to a DAQ channel, the firmware
will to the rest.
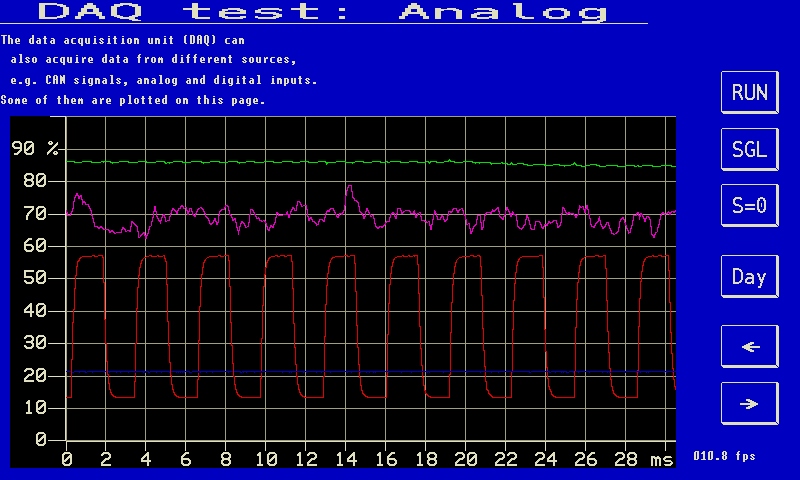
Example for a diagram fed with analog inputs via DAQ (here: first page in 'DAQ_Test.cvt'),
running with 20 kSamples/second on an MKT-View IV.
For the second display page ("CAN"), the DAQ collects samples from received CAN messages, with 1000 samples / second
(more would be possible from the DAQ's point of view, but it's not realistic with a CAN bus at 500 kBit/second).
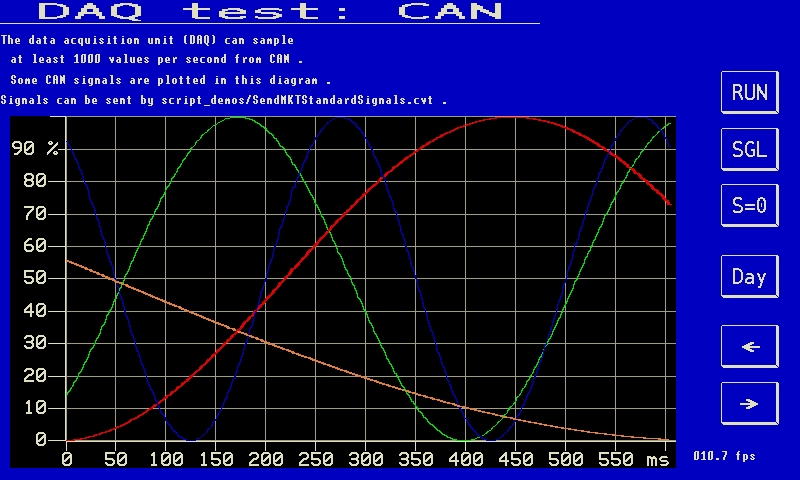
Waveforms of some signals received via CAN, collected by the DAQ with 1000 samples/second.
Also taken from applikation 'DAQ_Test.cvt', 2nd page, here running on an MKT-View IV.
The third display page uses the DAQ to collect 'audio samples' as explained here,
which are then processed via script (using the FFT) as explained here.
.
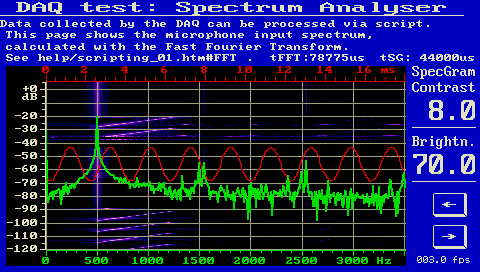
Example for a diagram with background image (here: spectrogramm from 'DAQ_Test.cvt').
Uses the DAQ to collect samples for the FFT from the MKT-View's microphone input.
The spectrogram (in the background of the curve) is painted via script into a Canvas object.
Last modified: 2024-06-20 by WB / MKT Systemtechnik .
